



2026 // Week 46 – Vietnam Pepper Market Update: US import trends through September 2026
Vietnamese Domestic Prices continue to rise
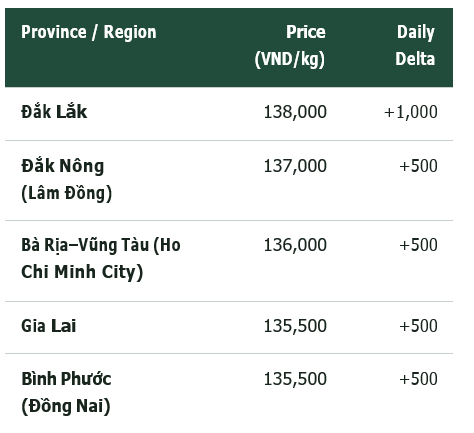
Domestic purchasing prices rose to VND 135,500 to 138,000 per kg, up VND 500 to 1,000/kg on the day. Compared with the previous week, domestic prices are now VND 1,000–1,500/kg higher.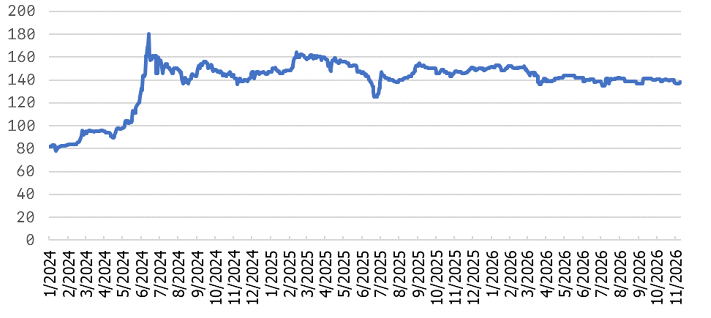
Pepper price developments in the Central Highlands and Southeast from First 2024 to 09-November, 2026 (Unit: VND/kg)
Stronger local buying supported prices.
COMMERCIAL OBSERVATION
Đak Lak prices carry a VND 2,500/kg premium over Gia Lai and Bình Phước (Đồng Nai). Local purchasing prices are distinct from FOB export offers, which cover a different stage of trade.
Global pepper offers remain broadly stable
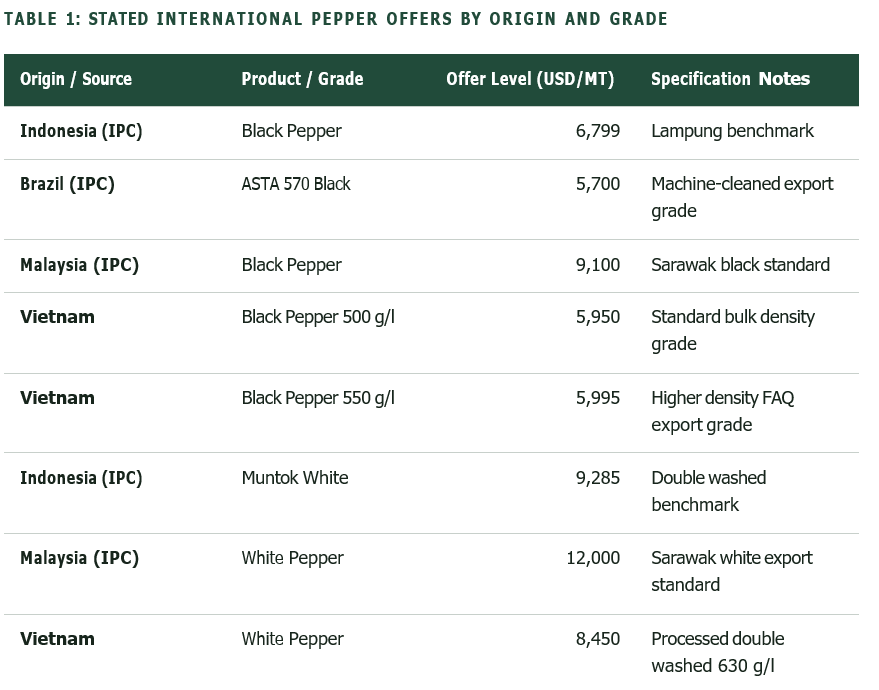
International export indications remain largely steady. IPC and regional trade-board quotes show price tiers shaped by density, cleaning grade and export logistics rather than aggressive seller discounting.
GRADE S SPECIFICATION COMPARISON CAVEAT
Offers differ in grade, density (500 g/l versus 550 g/l in Vietnam), processing (FAQ, machine cleaned, ASTA 570), incoterms and origin. They are not directly equivalent; spreads reflect milling, freight and trade terms.
US imports eased in September despite annual growth
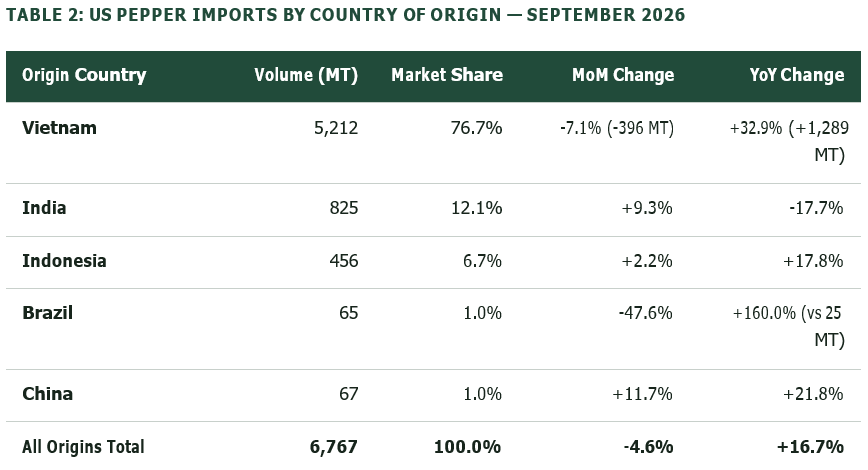
According to figures from the US International Trade Commission (ITC), US pepper imports reached 6,767 MT valued at USD 52.3 million in September 2026. Volume eased from August but remained above September 2025.
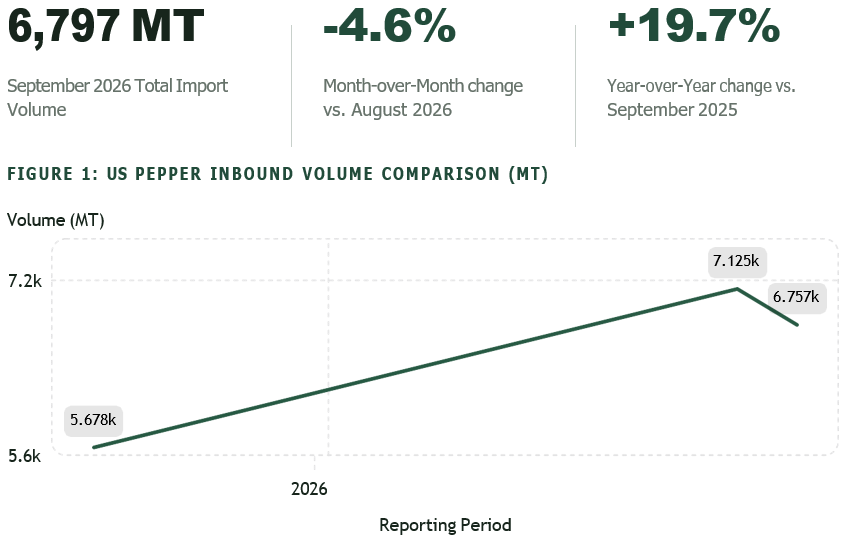
US International Trade Commission (ITC) customs data.
MONTHLY DYNAMICS
Total inbound value declined 4.4% month-over-month alongside the 4.6% dip in physical volume. While September arrivals contracted from August, volume rose 19.7% from September 2025.
Vietnam’s Position: accounted for most September shipments
US import statistics for September 2026 show that Vietnam retained dominant market leadership, supplying 5,212 MT—representing 76.7% of all black and white pepper cleared by US customs during the month. While Vietnamese arrivals contracted by 396 MT (-7.1%) from August levels, shipments expanded by 1,289 MT (+32.9%) compared to September 2025.
ORIGIN DIVERGENCE
Secondary suppliers demonstrated mixed performance in September. India consolidated its position as the number two exporter with 825 MT (+9.3% MoM, though down 17.7% YoY).
Brazil experienced sharp monthly volatility, tumbling 47.6% MoM to 65 MT, though this still represents a 160% jump from the minimal 25 MT recorded in September 2025.
US Import: Year-to-date growth masks a recent slowdown
US pepper imports in January–September 2026 reached 68,767 MT and USD 524.0 million. Volume rose 7.1% (+4,538 MT) and value rose 6.9% year over year, but quarterly activity slowed.
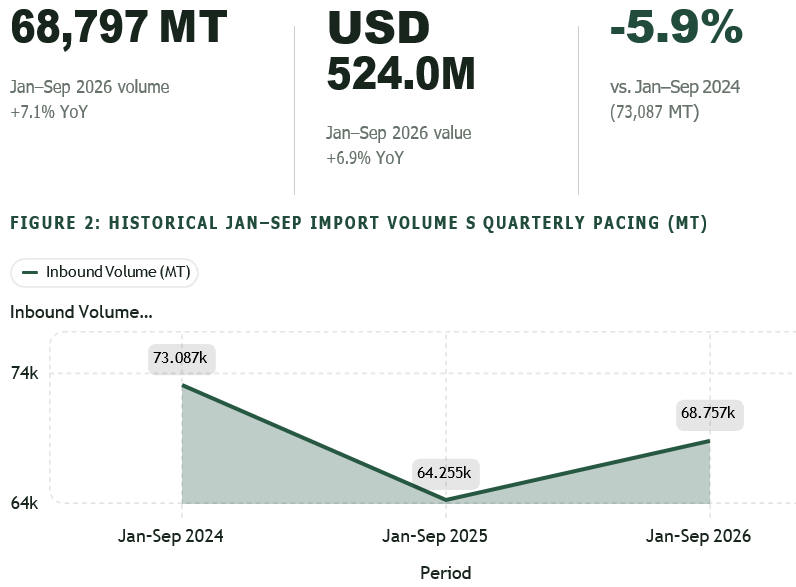
US ITC figures compiled for 9-month intervals.
QUARTERLY DECELERATION
Q3 2026 imports totaled 21,234 MT, 18.5% below Q2 2026, indicating slower recent import activity. Year-to-date volume remained 5.9% below the 73,087 MT recorded in January–September 2024.
US Market Share: Vietnam gained share as other origins lost ground
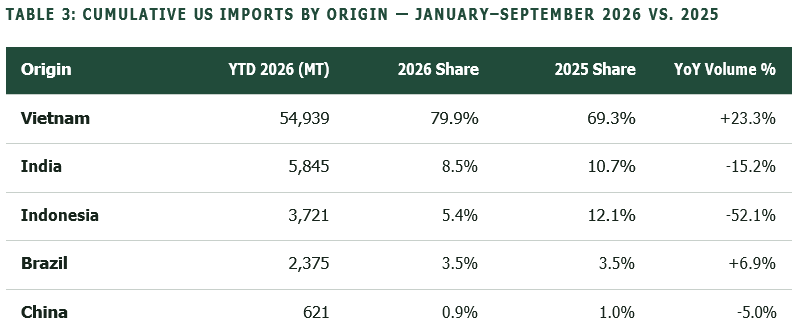
During January–September 2026, Vietnam dramatically expanded its footprint in the US market, shipping 54,636 MT. This represents an increase of 23.3% (+10,389 MT) year-over-year.
Vietnam’s market share climbed to 76.6%, up by approximately 10.5 percentage points from 69.3% in the prior year, absorbing market share surrendered by competitor origins.
MARKET SHARE REALIGNMENT
Vietnam’s volumetric surge (+10,389 MT) outstripped the total net growth of the entire US import market (+4,538 MT), actively offsetting steep declines from other key suppliers.
Indonesia contracted by more than half (-52.1% to 3,721 MT), with its market share collapsing from 12.1% to 5.4%, while India saw its share slip from 10.7% to 8.5%.